
New · Market Jukebox Core
The serious research tools, for $29 a month
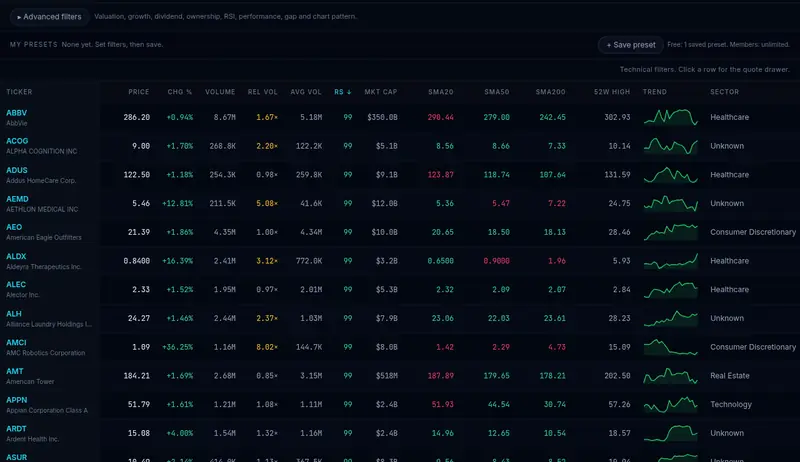
Core gives you quotes refreshed through the trading day, the advanced screener, 8 years of financials and the full insider list, without paying for the full trading suite.
Get Core for $29/monthOr $297 a year, about $24.75 a month. Upgrade to Full Access whenever you’re ready.
Pick the plan that fits how you trade
Start free, step up to Core for the research tools, or go all in with Full Access.
Free
Try the basics
No credit card
Get my free account- Basic stock screener
- Charts with delayed quotes
- Pattern Scanner & Guru Scans, 5 a day
- Investing School starter lessons
- Intel Desk stories & Community
Core
For self-directed researchers
About $24.75 a month, billed yearly. You save $51 vs. monthly.
Get Core yearly- Everything in Free, plus:
- Real-time quotes, refreshed through the trading day
- Advanced screener filters: valuation, growth, dividends, ownership, RSI, performance
- Unlimited saved presets & screen export
- Multiple portfolios & watchlists
- 8 years of financial statements
- The full insider trades list
- Pattern Scanner & Guru Scans, 15 a day
Full Access
The complete trading suite
About $83 a month, billed yearly. You save $191 vs. monthly.
See Full Access- Everything in Core, plus:
- Unlimited Pattern Scanner & Guru Scans
- Daily Setup Ideas & Primo Setups
- Whale Watch
- 36 Trade Desk tools, listed below — paper trading, scanners, valuation and more
See the full list - The full Investing School & Chart School
- Community perks
Subscriptions renew automatically until you cancel. Prices in US dollars.
Free vs. Core vs. Full Access
See exactly what each plan unlocks.
| Feature | Free | Core | Full Access |
|---|---|---|---|
| Stock screener | Basic | Advanced filters | Advanced filters |
| Quotes | Delayed | Real-time, refreshed through the day | Real-time, refreshed through the day |
| Saved screener presets | 1 | Unlimited | Unlimited |
| Export your screens | — | ✓ | ✓ |
| Portfolios & watchlists | 1 | Multiple | Multiple |
| Financial statements | 3 years | 8 years | 8 years |
| Insider trades | Preview | Full list | Full list |
| Pattern Scanner | 5 a day | 15 a day | Unlimited |
| Guru Scans | 5 a day | 15 a day | Unlimited |
| Intel Desk stories & Community | ✓ | ✓ | ✓ |
| Investing School | Starter lessons | Starter lessons | Full school + Chart School |
| Daily Setup Ideas & Primo Setups | — | — | ✓ |
| Whale Watch | — | — | ✓ |
| Trade Desk tools | Hub previews | Hub previews | All 36 tools |
| Community perks | — | — | ✓ |
| Price | $0 | $29/mo or $297/yr | $99/mo or $997/yr |
36 Trade Desk tools in Full Access
A single line does not show what you actually get. Here is every live Trade Desk tool, grouped by job, with a short note on what it is for. These tools unlock with Full Access. Core does not include them, except for a limited daily try of Remix and the Thematic Investing Scan.
What Core includes
Real-time quotes, advanced screener filters, unlimited saved presets and CSV export, multiple portfolios and watchlists, 8 years of financials, the full insider-trades list, and 15 Pattern Scanner runs and 15 Guru Scans a day — plus everything on the free plan.
What Full Access adds
Unlimited scans, Daily Setup Ideas, Primo Setups, Whale Watch, market-intelligence ideas, the full Investing School and Chart School, Community perks, and the 36 Trade Desk tools below.
Trade planning and practice
Size the trade, practice it on paper, and review what happened.
Paper Trading
Add tickers to a private paper book, set your entry, and track paper profit and loss as quotes update.
Remix
Build a trade recipe from starter idea packs and rules. Free and Core can save one recipe a day; Full Access is unlimited.
Position sizing calculator
Turn account size, risk percent, entry and stop into a share count and dollar risk before you put a trade on.
Stop Loss
Compare stop styles with plain examples, and see why smaller losses are easier to climb back from.
Trade journal
Keep a thesis, a grade and notes on your paper trades — open and closed — in one place.
Backtest / what-if
Run a simple hypothetical profit-and-loss path, or compare position sizes at a set dollar-risk budget.
Premarket / gap scanner
Sort names by gap or day move versus the prior close, with filters for size, relative volume and relative strength. Clearly labeled when the snapshot is end-of-day.
Multi-chart compare
Line up two to four symbols side by side in a larger chart workspace.
Saved custom scans
Save your own filter presets, then load or delete them whenever you come back.
Unusual options board
A live payoff-diagram calculator, plus an unusual equity-volume proxy. A full options chain is still on the way.
Market internals and sectors
See what the tape is doing, and which groups are leading or lagging.
Relative Strength matrix
Compare relative-strength ranks across sectors and peers so you can see which names are leading or lagging.
Market breadth
Advance/decline, new highs and lows, and participation gauges to judge whether a move has real backing.
Sector rotation
Track money moving between sectors and styles so you can line your ideas up with the current regime.
Liquidity / volume tools
Spot unusual volume and thin trading before you size into a name.
Short / float
Short interest, days to cover and percent of float, for squeeze context.
Market heatmap
Sector-to-stock tiles sized by dollar volume or market cap, colored by the day’s move.
World Markets
A regional map and country ETF board, with today, week, month, year-to-date and longer lookbacks.
Commodity Command
Precious metals, energy, industrial metals and agriculture proxies, with a heat map and sortable returns.
Correlation / pairs board
A correlation heat map and top pairs from a universe or watchlist.
Pivot / breakout checklist
An educational checklist on a symbol chart: volume, relative strength, key moving averages, tightness and near-highs.
E-mini / index futures
A futures-style panel for the major U.S. indexes, using familiar ETF proxies and clearly labeled when futures data isn’t available yet.
Research and company workups
Dig into a name, its peers, its filings and its valuation before you commit.
MJ Oracle
On-site search and questions across ideas, Community, guru notes and desk tools. It does not invent filings.
Company Document Desk
Jump to official company filings by ticker.
Financials & Estimates explorer
A company snapshot of key ratios, growth and margins, searchable by ticker.
Peer comps
A same-sector peers table with relative strength, valuation, growth and the day’s move.
Thematic Investing Scan
Scan a theme for tickers, with a short story and why each name shows up. Free and Core get a limited daily try; Full Access is unlimited.
Theme & ticker monitoring
A watchlist with delayed quotes and alert thresholds you set yourself.
Research Notebook
A diligence workspace for per-ticker notes, saved to your account when available.
Valuation models
Worksheet-style valuation, including a discounted-cash-flow sketch and comps, with optional prefill from company fundamentals.
Factor ranks
Quality, value and momentum-style percentile scores across the universe, for idea generation.
Portfolio analytics dashboard
Weights, profit and loss, sector mix and concentration for your paper book or Community portfolios.
Economic + earnings calendar
Upcoming earnings dates from company data, plus a light U.S. holiday and macro calendar.
Earnings reaction board
Recent and upcoming earnings joined to price action, so you can review how the name reacted.
Company one-pager pack
Print-ready multi-ticker snapshots you can save as a PDF from your browser.
Weekly digest preview
A preview of breadth, relative-strength leaders and Community highlights. Email delivery is still on the way.
IPOs
Upcoming and recent public offerings, with charts and performance since the IPO.
Free and Core can browse the Trade Desk hub. Remix and the Thematic Investing Scan also include a limited daily try. Opening the rest of these tools takes Full Access. Stock Ratings, the sector map, and browsing the Visualize hub stay available on every plan, including free.
On the way: broker connections (read-only account views), earnings smart summaries, and email alerts.
Built for traders who do their homework
Core covers the research side of Market Jukebox, so you can dig into any stock before you put money on it.
Screen with real depth
Go past price and volume. Filter by P/E, sales growth, dividend yield, ownership, RSI and performance, then save as many screens as you like.
Read the full story
Eight years of income statements, balance sheets and cash flow on every stock page, so you can see the trend, not just last quarter.
Follow the insiders
The full list of insider buys and sells from public filings, with filters for size, role and ticker.
Quotes that keep up
Prices refresh through the trading day, so your screens and watchlists reflect the market as it moves.
Three times the scans
15 Pattern Scanner runs and 15 Guru Scans every day, triple what the free plan gives you.
Organize your ideas
Keep separate portfolios and watchlists for swing trades, long-term holds and names you’re stalking.
Similar research plans cost more.
Finviz Elite lists at $39.50 a month. Market Jukebox Core is $29, or about $24.75 a month on the yearly plan.
Finviz pricing from finviz.com/elite, checked November 20, 2026, regular prices, not limited-time offers. Finviz is a trademark of its owner; Market Jukebox is not affiliated with it.
Questions
What’s the difference between Core and Full Access?
Core is the research toolkit: real-time quotes, the advanced screener, financials, insider trades and 15 scans a day. Full Access adds unlimited scans, Daily Setup Ideas, Primo Setups, Whale Watch, the full Investing School and Chart School, Community perks, and the Trade Desk — 36 tools for planning trades, reading the tape and researching companies. The full list is in the Trade Desk section above.
Can I upgrade from Core to Full Access later?
Yes. You can move up to Full Access any time from the Full Access page.
How does billing work?
Monthly is $29 a month. Yearly is $297 a year, which works out to about $24.75 a month. Both renew automatically until you cancel.
How do I sign in after I buy?
Use the email you buy with. You’ll get an email with your login details, then sign in at marketjukebox.com with the Members button.
What if Core isn’t the right fit?
We stand behind our work. We offer a 30-day exchange for any other product of equal or lesser value.
Get the research tools for $29
Real-time quotes, the advanced screener, 8 years of financials and the full insider list.
Get Core yearly